


enDAQ
enDAQ - Compact Data Loggers
Designed for Field Measurement of Vibration, Shock, and Environmental Conditions
enDAQ is a U.S.-based specialist in compact data loggers for measuring vibration, shock, motion and environmental conditions in laboratory and field applications. The platform combines measurement hardware, embedded sensors and analysis software, enabling engineers to collect reliable data and use it for design improvement, troubleshooting and performance validation.
enDAQ is a division of Mide Technology, part of the Hutchinson Group.
Understand What Your Product, Machine, Vehicle or Shipment Actually Experiences

enDAQ data loggers measure vibration, shock, acceleration, motion and environmental conditions directly in the field-without requiring a computer or a large laboratory DAQ system to remain connected during the test. The logger is mounted on the vehicle, machine, component, product or shipment, records the data to internal memory and allows engineers to review, analyze and convert the results into practical engineering conclusions. Depending on the model, one device may combine multiple sensors, event triggers, GPS location and Wi-Fi upload to the cloud.
Core value: instead of estimating what happened in the field, enDAQ enables engineers to measure, document and support decisions with recorded data.

Who Is enDAQ?
enDAQ Specialized in compact platforms for collecting and analyzing vibration, shock and environmental data. Its data loggers combine sensors, a rechargeable battery, internal memory and recording electronics in a single enclosure. This enables autonomous measurements in locations where a permanent connection to a computer, power supply or full DAQ system is impractical.
The products are designed for test, mechanical, system and reliability engineers, R&D teams and organizations performing road tests, field testing, machine monitoring, shipment documentation and shock testing. Depending on the model, users can select different enclosures, acceleration ranges, accelerometer technologies, battery capacities and communication capabilities.
What Is a Data Logger?
A data logger is a device that measures and stores data over time. Unlike a conventional sensor, which produces an electrical or digital signal and normally requires an external system to read it, a data logger integrates the sensor with recording electronics, internal memory and a battery. Measurement parameters are configured before the test.
A typical laboratory DAQ system may include external sensors, cables, power supplies, data acquisition units and a computer. Such systems are highly suitable for complex laboratory tests, but can be cumbersome during a road test, international shipment, operation inside a moving machine or testing at a remote site. An autonomous data logger can be mounted directly on the test object and record the test without a computer connected in real time.
After the test, the logger is connected to a computer and the recorded files can be viewed in enDAQ LAB or uploaded to enDAQ Cloud. W-series models can also be configured to upload completed recordings through a Wi-Fi network.
From a Simple Measurement Process to an Engineering Decision
- Mount the data logger on the product, machine, vehicle or shipment.
- Configure the sensors, sample rates, recording duration and triggers.
- Perform the experiment, road test, shipment or field test.
- Copy the recording to a computer or upload it to the cloud.
- Analyze the data in the time and frequency domains.
- Use the results for troubleshooting, requirement validation, design improvement or the definition of a realistic laboratory test profile.
Correct mechanical mounting is essential. A flexible connection, contaminated surface or insufficiently rigid installation can affect the frequency response and produce data that does not accurately represent the motion of the test object.
What Can enDAQ Data Loggers Measure?

Vibration
Measuring acceleration over time makes it possible to quantify vibration levels, identify dominant frequencies and resonances, and compare operating conditions or disturbance sources. Typical applications include machinery, transportation systems, electromechanical assemblies, structures and moving components.
Shock and Impact
A shock event is a rapid, short-duration change in acceleration, such as a drop, collision, obstacle crossing or improper handling of a shipment. Models with piezoresistive accelerometers and high acceleration ranges are particularly suitable for shock measurements in which signal clipping must be avoided.
Acceleration
Three-axis acceleration measurement can document dynamic motion, braking, acceleration, changes in direction and forces acting on a product. It is useful in vehicle testing, braking studies, mobile equipment testing and impact investigations.
Temperature
Temperature data helps determine whether a mechanical event occurred at the same time as a thermal change, document storage and shipment conditions, or compare product performance at different temperatures.
Humidity
Relative humidity measurement is useful in shipment, storage and environmental testing where moisture ingress or condensation may affect the product. The operating limitations and non-condensing requirements of the selected model should be checked.
Atmospheric Pressure
Ambient pressure can help document changes in altitude, flight, transportation or environmental conditions. When combined with time and additional sensor channels, it provides greater context for events that occurred during a test.
Light
The light sensor can indicate a change in exposure conditions, opening of a package, transition between a closed and open environment, or a specific stage in the test process.
Rotation and Angular Velocity – Gyroscope
A gyroscope measures rotational speed around the device axes. The data can indicate tilt, rotation, direction changes or angular motion of a vehicle, shipment or mechanical assembly.
Magnetic Field – Magnetometer
A three-axis magnetometer measures the surrounding magnetic field. It can support direction and motion measurements or identify changes in the magnetic environment.
GPS Position and Time
Applicable W-series models can record GPS position and time. This allows a vibration or shock event to be linked to a specific point on a route and helps identify where an exception occurred during a road test or shipment. GPS is not included in the S series.
Sound
W-series models also include a microphone, allowing acoustic information to be compared with vibration or other operating conditions. Sound measurement is not a capability of every enDAQ product family.
Key Benefits of enDAQ Data Loggers
Autonomous Measurement Without a Connected Computer
The logger includes sensors, memory and a battery, so a computer does not need to remain connected during the test. This simplifies road testing, measurements inside machinery and field work.
Multiple Data Channels in One Device
In addition to acceleration, different models integrate motion and environmental sensors. Engineers can therefore evaluate not only vibration magnitude, but also temperature, humidity, pressure, orientation or location at the time of an event.
Fast Setup and Installation
Configuration is performed in enDAQ LAB, including channel selection, sample rates, device name and trigger conditions. The logger is then disconnected, mounted and started for autonomous recording.
Multiple Acceleration Ranges and Sensing Technologies
enDAQ offers models based on capacitive, piezoelectric and piezoresistive accelerometers. Each technology offers different advantages in resolution, DC response, frequency range and high-shock measurement capability.
Sample Rates for Dynamic Events
On selected models, the primary accelerometer can record at sample rates of tens of thousands of samples per second, enabling the capture of fast events. The exact performance depends on the selected sensor and part number.
Triggers and Wake Conditions
The start of recording and channel sample rates can be configured for the application. Appropriate use of triggers can reduce irrelevant recording time and improve battery and memory utilization.
Software for Basic and Advanced Analysis
enDAQ LAB supports data viewing, export and analyses such as FFT, PSD and spectrograms. enDAQ Cloud adds organization, sharing, reports, metrics and alerts, while Python libraries enable customized analysis workflows.
Wi-Fi and GPS Capabilities on W-Series Models
The W5 and W8 series add Wi-Fi connectivity, GPS and a microphone. Completed recordings can be uploaded to the cloud according to the device configuration and network availability.
Sensor types, measurement ranges and sample rates vary between models. Not every device includes every capability described above, so the data sheet of the selected part number must be reviewed.
Key Applications
Road Testing and Transportation
During a road test, the data logger can be mounted on the chassis, an assembly, a seat, packaging, the cargo compartment or a specific component. The data documents actual route conditions, including urban driving, rough roads, speed bumps, speed changes, braking or rail travel.
Instead of relying only on driver feedback or a verbal description of the problem, the engineer receives a recorded acceleration history for the selected channels and sample rate. Vibration magnitude, duration and dominant frequencies can be analyzed, and a GPS-enabled model can associate events with specific route locations.
Monitoring Sensitive Shipments and Cargo
The data logger can be installed on the product, inside the packaging or on the transport structure to record the conditions throughout shipment. This helps identify abnormal shocks, extended vibration, environmental changes or stages in which the package was handled differently than expected.
The value goes beyond recording peak acceleration. Raw data can be used to examine shock duration and vibration frequency content, improve packaging and create a laboratory test profile that more accurately represents real transportation conditions.
Machine and Equipment Vibration Testing
A data logger can be attached to a machine and used to compare multiple operating states: low and high speed, different loads, before and after a mechanical change, or before and after installing an isolation or damping solution.
Fast Fourier Transform (FFT) separates the time signal into frequency components and shows where vibration energy is concentrated. Power Spectral Density (PSD) describes how vibration power is distributed across the frequency range and is particularly useful for random vibration and laboratory test profile development.
Drop, Impact and Shock Testing
Drop and impact events are very short, so they require an appropriate acceleration range, sufficient sample rate and rigid mounting. A range that is too low can cause clipping, while an unnecessarily high range can reduce resolution for lower-level events.
A Shock Response Spectrum (SRS) describes how a series of theoretical systems with different natural frequencies would respond to a shock event. It helps evaluate the potential severity of the event for components and structures rather than relying only on maximum acceleration. enDAQ Python libraries support SRS calculation.
Product Development and Validation
Field data can be used to define engineering requirements based on actual operating conditions. For example, a product can be measured during transportation, the PSD can be calculated and a laboratory shaker test can be created to represent the measured environment.
The same data can be used to compare design versions, identify weak points, evaluate isolation solutions, validate changes in material or mechanical connections, and verify compliance with project requirements.
Monitoring High-Value Assets and Equipment
For medical, optical, scientific or industrial equipment, an event that causes no visible external damage may still affect calibration or performance. Measurements during operation, storage or transportation provide a documented record of the conditions experienced by the asset and support the investigation of abnormal events.
Wireless Monitoring
W-series models can connect to a Wi-Fi network and upload recordings to enDAQ Cloud. The cloud platform can organize files, generate reports, calculate metrics and create alerts based on uploaded data.
The capability should be described precisely: the device uploads completed recordings and the cloud generates metrics and alerts. This does not necessarily mean that the complete raw vibration signal is streamed continuously in real time. Upload behavior is configured in enDAQ LAB.
enDAQ Data Logger Product Families
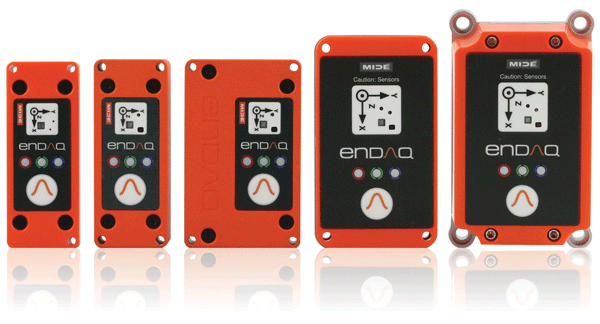
The product families differ mainly in enclosure construction, battery capacity, communication capabilities and accelerometer selection. Multiple part numbers are available within each family, so the series name alone is not sufficient for final product selection.

S3/S4 – Standard Series
S3 and S4 are suitable for a wide range of autonomous field and laboratory tests. S3 uses a polycarbonate enclosure, while S4 uses a more rigid aluminum enclosure. According to the manufacturer’s selection guide, the aluminum construction supports a wider usable frequency range and provides improved mechanical durability for repeated installation or demanding environments.
S5 – Longer Recording Duration
S5 combines an aluminum enclosure with a larger battery than the S3 and S4 families. It is suitable when test duration is a primary consideration, such as long road tests, shipment monitoring, multi-cycle testing or applications in which the logger cannot be accessed frequently.
W5/W8 – Wi-Fi, GPS and Cloud Connectivity
The W families add Wi-Fi, GPS and a microphone alongside motion and environmental sensors. W5 is suitable when a slim unit and wireless connectivity are required, while W8 offers a larger battery and a wider operating temperature range. The exact part number and accelerometer technology must be selected for each application.
How to Select the Right Data Logger
What Do You Need to Measure?

First define whether the objective is to measure low-level vibration, low-frequency motion, severe shock, environmental conditions or a combination of these. Measuring motor vibration requires different characteristics from recording a product drop or a road test.
What Acceleration Level Is Expected?
The acceleration range must be high enough to avoid clipping peak events, but should not be unnecessarily high. A lower range normally provides better resolution for low-level vibration, while a higher range is required for severe shock events.
Which Frequency Range Is Important?
Define the highest frequency that must be analyzed. The accelerometer type, enclosure and sample rate should support this range. A rigid aluminum enclosure may be preferable for applications that require a higher usable bandwidth.
How Long Will the Test Last?
Test duration affects the product family, sample rate, number of active channels and trigger strategy. Continuous high-rate recording consumes more battery capacity and memory than periodic or event-triggered recording.
What Sample Rate Is Required?
The sample rate must be high enough to capture the required frequency content and short-duration events. The highest available rate should not be selected automatically, because unnecessary sample rates increase data volume and power consumption.
Are GPS or Wi-Fi Required?
GPS is useful for route, transportation and shipment tests in which the location of an event matters. Wi-Fi is useful when completed recordings should be uploaded to the cloud without collecting each unit manually. These capabilities are available on W-series models.
Are Reports, Cloud Access or Alerts Required?
When several users need access to the data, multiple devices are deployed, or reports and alerts are required, integration with enDAQ Cloud should be considered.
What Environmental Conditions Will the Device Experience?
Review the temperature, humidity and pressure ranges, potential condensation, exposure to dust or water, and charging requirements. Operating limits vary between S3/S4, S5/W5 and W8 models.
How Will the Logger Be Mounted?
Define the mounting location, axis orientation, surface type and attachment method in advance. Screws, a suitable adhesive or a rigid adapter are generally preferable for higher-frequency measurements compared with a loose or flexible attachment.
Software and Data Analysis
enDAQ LAB
enDAQ LAB is the primary software for configuring devices and reviewing recorded data. Users can define the device name, active channels, sample rates, operating conditions and channel calibration. The software supports multichannel viewing, basic analysis and export of IDE files to formats including CSV, TXT and MAT.
The software includes FFT, PSD and spectrogram tools. A spectrogram shows how frequency content changes over time and is useful when operating conditions are not constantnfor example, when vehicle or machine speed changes during the test. The current version is designed for Windows computers.

enDAQ Cloud
enDAQ Cloud allows users to upload, organize, search and share measurement files. It can generate interactive reports, organize files by serial number, date or tags, export tables and share links with a limited validity period.
The platform can generate metrics such as acceleration RMS and peak, GPS location, temperature, pressure, gyroscope RMS, velocity, displacement and pseudo velocity. Alerts can be defined using metrics calculated from uploaded recordings. Available services and storage capacity vary by cloud plan and should be confirmed before implementation.

Open-Source Python Libraries
The enDAQ open-source Python libraries are intended for users who want to automate analysis, integrate measurements into an existing process or generate customized reports. The libraries can read and interpret IDE files, calculate PSD and SRS, integrate acceleration into velocity and displacement, and perform resampling.
This option is suitable for R&D, data analysis and reliability teams that process many tests, compare multiple files or want to integrate measurement results into an organizational data pipeline.
Example Workflow: Measuring Vibration and Shock During a Road Test
1. Define the Test Objective
Before installation, define the engineering question. For example: does a specific assembly experience abnormal vibration on a rough road, and are the measured frequencies close to a structural natural frequency?
2. Select the Logger and Measurement Range
For normal vibration with moderate events, a model with a capacitive or piezoelectric accelerometer may be considered. If severe impacts are possible, a piezoresistive model or a higher acceleration range should be evaluated.
3. Mount the Device
Mount the logger rigidly and as close as practical to the point being characterized. Document the X, Y and Z axis orientation and verify that the enclosure cannot move relative to the mounting surface.
4. Configure Sample Rates and Triggers
Select the sample rate according to the required frequency range. Continuous recording, event triggering or time-based recording can be configured according to the road-test duration and desired data volume.
5. Perform the Road Test
Drive a documented route that includes the relevant operating conditions. Record start times, speed changes, road-surface transitions and known events so they can be compared with the measured data.
6. Download the Data
At the end of the test, copy the IDE file to a computer. A W-series model can also be configured to upload the completed recording to the cloud through Wi-Fi.
7. Analyze Time and Frequency Data
First review acceleration versus time and identify peaks, abnormal intervals and differences between axes. Then use FFT, PSD or a spectrogram to identify dominant frequencies and changes throughout the route.
8. Draw Engineering Conclusions
Compare the measurements with product requirements, natural frequencies, component limits or previous design results. The analysis can help determine whether the source is the road, engine, mechanical looseness, structural resonance or a combination of factors.
9. Convert the Results into Action
The findings may lead to a stiffness change, added isolation, component relocation, connection reinforcement or the definition of a laboratory shaker profile. After the change, repeat the measurement on the same route and compare the results.
Case Studies
Explore the enDAQ Shock & Vibration Resources Center
Measuring Bicycle Braking Performance
Challenge: Momentum Engineering needed to quantify the deceleration of different bicycle types for accident reconstruction. Data from road bicycles would not necessarily represent BMX bicycles or other brake configurations.
Use of enDAQ: an S4-E25D40 logger was mounted on eight bicycles and controlled stopping tests were performed. The recordings were synchronized with video using time stamps.
Data collected: acceleration, deceleration and vibration during the braking stages.
Result: the company separated the deceleration signal from vibration, quantified differences between brake configurations and published the findings as a technical paper through SAE International.
Diagnosing Vibration on an Urban Rail Line
Challenge: repeated failures in trackside equipment caused service interruptions, and engineers needed to determine whether elevated vibration was a primary contributor.
Use of enDAQ: S4 units were configured in advance and installed beside the track during short maintenance windows. Data was collected during normal operation and used to compare conditions before and after corrective actions.
Data collected: acceleration and frequency content during train pass-by events.
Result: frequency analysis helped relate vibration levels to the failures, evaluate the effects of speed restrictions and damping measures, and support a condition-based monitoring approach.
Measuring a Motorcycle-to-Vehicle Impact
Challenge: accident reconstruction engineers wanted to compare the vehicle’s Event Data Recorder information with the actual change in velocity measured on the motorcycle.
Use of enDAQ: enDAQ units were installed near the centers of gravity of the vehicles during three controlled collision tests.
Data collected: acceleration, change in velocity, event duration and angular motion.
Result: direct measurement enabled comparison between EDR calculations and the measured event severity, supporting a more data-based framework for reconstruction.
Selecting a data logger involves more than choosing an acceleration range from a catalog. The accelerometer technology, vibration or shock level, frequency range, recording duration, environmental conditions, mounting method and analysis process must all be considered together.
Medital Novelty supports Israeli customers throughout the process:
· Define the measurement objective and key parameters.
· Select the appropriate product family and part number.
· Match acceleration ranges and sample rates to the application.
· Evaluate the need for GPS, Wi-Fi or cloud operation.
· Provide a product demonstration and introduction to setup and recording.
· Support the initial installation and measurement stage.
· Guide the use of enDAQ LAB, Cloud or Python tools.
· Maintain direct technical and commercial communication with the manufacturer.
· Provide local service and support in Israel.
Contact Medital’s engineers to select the right enDAQ solution for your application.
Summary
A vibration data logger turns assumptions about field conditions into engineering data that can be reviewed and compared. enDAQ data loggers combine acceleration, vibration, shock and environmental sensors in a compact device, with GPS, Wi-Fi and sound available on applicable W-series models.
The combination of hardware, enDAQ LAB, enDAQ Cloud and Python tools supports the complete workflow from raw recording to FFT, PSD, SRS, reports, alerts and design conclusions. Medital supports device selection, test definition, demonstrations and implementation in Israel.
Series Comparison Table
|
Family |
Status and Primary Use |
Enclosure / Main Feature |
Sensors |
Communication and GPS |
Relative Recording Duration |
Main Advantage |
Recommended Applications |
|
S3 |
General autonomous recording |
Polycarbonate enclosure; 250 mAh battery |
Capacitive, piezoelectric or other accelerometer depending on part number, with motion and environmental sensors |
USB; no GPS/Wi-Fi |
Short to medium, depending on configuration |
Accessible, lightweight option for general testing |
Vibration tests, development testing, short road tests and environmental measurements. |
|
S4 |
Standard autonomous recording for demanding applications |
Aluminum enclosure; 250 mAh battery; improved rigidity and usable bandwidth compared with S3 |
Multiple accelerometer options, including high shock ranges, depending on part number |
USB; no GPS/Wi-Fi |
Short to medium |
Rigid enclosure suitable for higher-frequency measurement and repeated use |
Machinery, vehicles, shock testing, product development and validation. |
|
S5 |
Extended autonomous recording |
Aluminum enclosure; 850 mAh battery, the largest in the S family |
Multiple accelerometers and motion/environmental sensors depending on the model |
USB; no GPS/Wi-Fi |
Longer than S3/S4 |
Longer operating time before the device must be collected |
Shipments, long road tests, extended experiments and periodic monitoring. |
|
W5 |
Recording and monitoring with Wi-Fi |
Slim polycarbonate/aluminum construction; 1,250 mAh battery |
Accelerometer according to part number, motion and environmental sensors, microphone and GPS |
Wi-Fi, GPS and USB |
Extended |
Wireless connectivity in a slim enclosure |
Wireless monitoring, road tests, shipments and assets requiring cloud upload. |
|
W8 |
Long-duration wireless recording for demanding environments |
Aluminum enclosure; 4,000 mAh battery; wider environmental operating range |
Multiple accelerometers, motion and environmental sensors, microphone and GPS |
Wi-Fi, GPS and USB |
Longest among the families shown |
Large battery, rigid enclosure and cloud connectivity |
Asset monitoring, long shipments, transportation, machinery and difficult-to-access locations. |
Software Comparison Table
|
Tool |
Primary Use |
User Level |
Main Capabilities |
Recommended Use |
|
Device configuration, initial review and export |
Basic to intermediate |
Channel configuration, sample rates and triggers; multichannel viewing; FFT, PSD and spectrograms; export to CSV, TXT and MAT |
At the beginning of every project, for device configuration, quick review and export to other tools. |
|
|
Organization, sharing, reports and alerts |
Basic to advanced |
Data upload, interactive reports, tags, search, sharing, acceleration and environmental metrics, alerts and API access |
When several users or devices are involved, remote access is required, or metrics need to be tracked over time. |
|
|
Automation and customized analysis |
Advanced |
IDE reading, PSD, SRS, integration to velocity and displacement, resampling, and automated reports or analysis workflows |
For teams performing repeat analysis, file comparison, automated processing or integration with organizational systems. |
Frequently Asked Questions
What Is a Data Logger?
A data logger measures and stores data over time. enDAQ loggers combine sensors, battery, internal memory and recording electronics in one unit. The device is configured in advance, mounted on the test object and operated without a connected computer. The resulting file can then be analyzed using enDAQ LAB, Cloud or Python tools.
What Is the Difference Between a Data Logger and an Accelerometer?
An accelerometer is a sensor that measures acceleration. A data logger is a complete system that includes one or more accelerometers, signal conversion and recording electronics, memory, a battery and configuration software. An external accelerometer generally requires a DAQ system or controller, while a data logger can record autonomously.
How Can Vibration Be Measured During a Road Test?
Mount the logger rigidly on the vehicle or assembly, define the axes, sample rate and recording duration, and drive a documented route. After the test, analyze acceleration versus time, FFT, PSD or a spectrogram. A W-series model can add GPS data to associate events with route locations.
Can enDAQ Devices Measure High-Level Shock?
Yes. Models are available with high acceleration ranges and piezoresistive accelerometers intended for shock events. Select a range that prevents clipping and ensure that the sample rate and mounting method are appropriate for the event duration and frequency content. Not every model is suitable for the same shock level.
Can Temperature and Humidity Be Measured Together with Vibration?
Yes. Many models combine temperature, humidity and pressure sensors with the acceleration channels. This helps determine whether a mechanical event occurred at the same time as an environmental change. Review the selected part number to confirm the active sensors, measurement ranges and sample rates.
Is a Computer Required During Recording?
No. After configuration, the logger can be disconnected from the computer, installed and operated autonomously. A computer is required for initial setup and file transfer after the test. W-series models can also be configured to upload completed recordings to the cloud through Wi-Fi.
How Are the Data Files Downloaded?
For S-series models, connect the logger to a computer and copy the recording files to a local drive. The files can be opened in enDAQ LAB, exported to common formats or uploaded manually to the cloud. W-series models can upload recordings through Wi-Fi when this function is enabled.
What Is the Difference Between the S and W Series?
The S series is primarily intended for autonomous recording and USB data transfer. The W series adds Wi-Fi, GPS and a microphone, and can upload completed recordings to enDAQ Cloud. Each family contains several models with different acceleration ranges and accelerometer technologies.
Can Remote Alerts Be Generated?
enDAQ Cloud can generate alerts based on metrics calculated from uploaded recordings, such as peak or RMS acceleration, temperature and other parameters. W-series models can upload recordings automatically through Wi-Fi. The alert is generated after cloud processing and is not necessarily an immediate live-streaming alert.
How Should the Acceleration Range Be Selected?
Estimate the maximum expected acceleration and include sufficient margin to prevent clipping. At the same time, avoid selecting an unnecessarily high range, because a wider range can reduce resolution for lower-level events. When the environment is not known, perform a preliminary test or consult Medital’s engineers.
E-mail: novelty@medital.co.il
Company Tel: 073-2000260
Yaron Dean
E-mail: yaron@medital.co.il
Mobile: 054-4923212
Direct Tel: 073-2000212
Guy Issler
E-mail: Guy@medital.co.il
Mobile: 054-4973300
Direct Tel: 073-2000216
Dvir Shemesh
E-mail: Dvir@medital.co.il
Mobile: 052-5228818
Direct Tel: 073-2000252
Roman Shapira
E-mail: roman@medital.co.il
Mobile: 054-7661003
Direct Tel: 073-2000239
